Creating an iOS bar chart in code using Swift and UIKit

In this post, I'll build a simple bar chart in code, and add it to a the default UIViewController created by an Xcode template project.
The techniques you'll learn in this article are:
- Creating a UIView entirely in code
- Adding Auto Layout constraints to views in the hierarchy using code
- Calculating view sizes and relationships at runtime
- Applying a corner radius to a UIView
- Using a tap gesture recognizer to detect user interaction
- Using hit testing to determine which subview (i.e. bar) is underneath a user tap
Requirements
Here are the requirements for the simple bar chart. Read the requirements and think about why this is not a good candidate a storyboard view, and why creating this view in code is a better choice.
- The chart will contain 1 or more vertical columns (bars), spaced equally in the view
- The height of each bar will reflect the bar's relative value compared to all other bars
- When the user taps on a bar, it will be highlighted, and all non-selected bars will not be highlighted.
The following shows what the final bar chart product will look like, and how the view hierarchy will be constructed to support requirements.
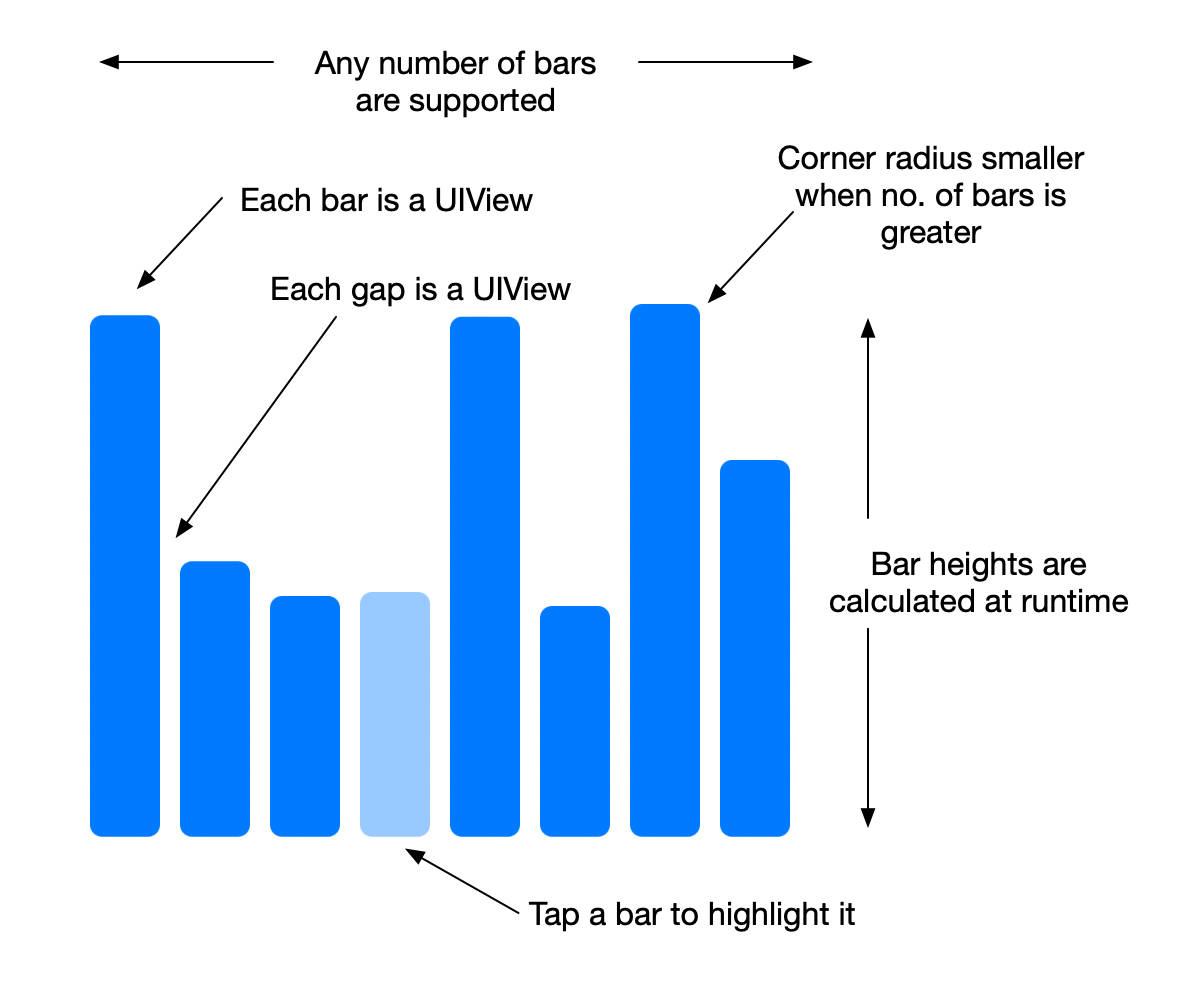
Why does a coded UIView make sense here?
Which requirement(s) aren't a good fit for a Storyboard (or XIB)? Probably all of them--but especially the first one. The number of views (bars) in the chart won't be known until runtime. Storyboards aren't really designed for dynamic numbers of views, so designing this view in code will actually be easier than using a Storyboard.
It may be possible to meet these requirements–at least in part–using a horizontal UICollectionView configured in a Storyboard, and controlled in the UIViewController via delegates. However, a coded UIView is still better since a standard view hierarchy will provide better control over the appearance and interactivity of the chart.
Implementation of the UIView
Let's start with the chart UIView first. After we code it, we'll create a Storyboard-based UIViewController and add this UIView to the storyboard. This type of hybrid approach – custom views added to storyboards– is common, and reinforces that storyboard vs. code doesn't have to be either/or...they can be used together.
In practice you'd probably create the Storyboard, and add the UIView to it. This way you can run the app in the simulator during view development to see how it's evolving as you go. But for the purposes of making this post flow linearly, I'll talk through the UIView first.
Create TutorialChartView.swift
- In Xcode, select File/New, or press ⌘N
- Select the Cocoa Touch source file type
- Name the new class TutorialChartView
Create a View Model for the TutorialChartView
The chart has certain data elements that drive its appearance, such as the data values, number of bars, etc. We'll put this data into a View Model to maintain separation of concerns between model and view.
- In Xcode, select File/New, or press ⌘N
- Select the Swift File source file type
- Name the new class TutorialChartViewModel
Create the View Model
The View Model is simple for this View. It mainly collects the data that will be displayed, the bar color (which is a constant since this is a tutorial), and a few calculated properties to help the view know how to set constraint values.
class TutorialChartViewModel {
    var dataPoints = [Double]()
    var barColor = UIColor.systemBlue

    var maxY : Double {
        return dataPoints.sorted(by: >).first ?? 0
    }

    var barGapPctOfTotal : CGFloat {
        return CGFloat(0.2) / CGFloat(dataPoints.count - 1)
    }

    var barWidthPctOfTotal : CGFloat {
        return CGFloat(0.8) / CGFloat(dataPoints.count)
    }

    var barCornerRadius : CGFloat {
        return CGFloat(50 / dataPoints.count)
    }
}
Create the Main Structure of the TutorialChartView
First, add the following structure to the TutorialChartView.swift file. This will establish the basic structure of the custom UIView, which will be discussed below.
import UIKit

class TutorialChartView: UIView {
    var viewModel = TutorialChartViewModel()
    var tapRecognizer:UITapGestureRecognizer!

    func setData(_ dataPoints: [Double]) {
       viewModel.dataPoints = dataPoints
    }

    func clearViews() {
    }

    func createChart() {
    }

    func createBarView(barNumber: Int, barValue: Double) -> UIView {
    }

    func createGapView(lastBar: UIView) -> UIView {
    }

    @objc func handleBarTap() {
    }
}
This establishes the top-level structure of the custom view. First, let's overview what these methods will do. Then we'll implement and explain them one at a time.
- viewModel is used to store the data that drives the appearance of the view.
- tapRecognizer will be used to detect a tap in the view.
- setData is called from the View Controller when the chart should display a new data set.
- clearViews is a utility function that removes all current content from the chart view.
- createChart loops through the data points, creating a UIView for each bar, and applying styling and Auto Layout constraints to size and position each bar
- createBarView is called by createChart to create an individual bar. Called once for each data point in the dataPoints array
- createGapView creates an invisible view to maintain the gap between bars.
- handleBarTap is called when the user taps on the chart. It uses hit testing to find the bar that the user is tapping on.
setData
This method is called from the View Controller (typically) to provide bar data to the chart. It does the following:
Saves the data in the View Model
Clears the view hierarchy
Checks that the data isn't empty
Calls createChart() to create the bars and gaps (which will automatically cause the chart to redraw)
func setData(_ dataPoints: [Double]) {
backgroundColor = UIColor.clear
      viewModel.dataPoints = dataPoints
      clearViews()

      // Do not continue if no bar has height > 0
      guard viewModel.maxY > 0.0 else { return }

      createChart()
  }
clearViews
This small routine simply removes all subviews from the chart view. In the demo app UI, the chart is set with new data when the user selects the number of bars from a segment control. This routine ensures unused views will be removed and released from memory as the new chart state is drawn.
    func clearViews() {
        for view in subviews {
            view.removeFromSuperview()
        }
    }
createChart
This routine does the work of adding UIViews to the chart to represent bars and the gaps between bars.
Important notes for this code:
- The Bar and Gap UIViews are created by methods createBarView and createGapView (respectively). We'll cover those methods below.
- A gap isn't added before the first bar, since the gap is only needed between the bars.
- Bar widths, bar gaps, and the bar heights are all calculated relative to the width and height of the containing view. By calculating sizes in this way, the chart will size itself appropriately on any screen size and device (i.e. iPad landscape, iPhone portrait, etc.).
- By creating constraints using the* .constraint(...)* methods, it's simple to wrap if/then statements around them so the logic for where constraints are placed is clean and concise.
Note that when creating constraints, they are disabled by default. If the "isActive=true" is not added to a constraint call, the constraint will be added, but will not be used at runtime. In older versions of Xcode this was easy to overlook (I did all the time!). Mercifully, Xcode 12 will warn you if you forget to specify the isActive state when creating a constraint. 👍🏻
func createChart() {
        var lastBar:UIView?

        for (i, dataPoint) in viewModel.dataPoints.enumerated() {
            let barView = createBarView(barNumber: i,
                                        barValue: dataPoint)

            if let lastBar = lastBar {
                // there is a bar to the left of this one, add a gap
                let gapView = createGapView(lastBar: lastBar)
                barView.leftAnchor.constraint(
                           equalTo: gapView.rightAnchor).isActive = true
            } else
                // this is the 1st bar in the chart
                barView.leftAnchor.constraint(
                           equalTo: leftAnchor).isActive = true
            }

            // Pin the right edge of the last bar to view's right side
            if i == viewModel.dataPoints.count - 1 {
                barView.rightAnchor.constraint(
                           equalTo: rightAnchor).isActive = true
            }

            // All bars pinned to bottom of containing view
            barView.bottomAnchor.constraint(
                           equalTo: bottomAnchor).isActive = true

            // calculate height of bar relative to maxY
            barView.heightAnchor.constraint(
                            equalTo: heightAnchor,
                            multiplier: CGFloat(dataPoint /
                                    viewModel.maxY)).isActive = true

            lastBar = barView
        }
    }
createBarView
This routine creates a single bar as a UIView.
The pattern for adding a subview to a UIView is consistent and worth memorizing:
- Create the UIView
- Add it to the view hierarchy by calling addSubView(..)
- Turn off auto-creation of constraints by setting translatesAutoresizingMaskIntoConstraints to false
- Add constraints
- Configure other view properties as needed
Note: adding constraints before adding the view to its parent view will lead to a crash. Get in the habit of always calling addSubview after creating a view.
Note: if you forget to set translatesAutoresizingMaskIntoConstraints to false, strange layouts will result. Essentially iOS will fully constrain the view according to its assumptions, and the constraints you add will be conflicting constraints. iOS will respond by disabling some constraints, but probably not the ones you expect or hope for.
func createBarView(barNumber: Int, barValue: Double) -> UIView {
        let barView = UIView()
        addSubview(barView)
        barView.translatesAutoresizingMaskIntoConstraints = false

        barView.widthAnchor.constraint(
                      equalTo: widthAnchor,
                      multiplier: viewModel.barWidthPctOfTotal).isActive = true

        barView.tag = barNumber + 1000
        barView.backgroundColor = viewModel.barColor
        barView.layer.cornerRadius = viewModel.barCornerRadius

        return barView
    }
createGapView
Similar to createBarView, this routine adds invisible views *between *bars. The gaps are calculated as a proportion of the overall width (i.e. gap view widths should add up to 20% of the chart's view width). Using these invisible views allows us to use the *.constraint(width, multiplier) *constraint to calculate the gap width.
If the bar gap was fixed, then we could instead set the left edge of each bar to the right edge of the previous bar, plus a constant value. This would eliminate the need for the invisible gap views. I wanted the gaps to be proportional on different screen sizes, so I elected this approach.
func createGapView(lastBar: UIView) -> UIView {
        let gapView = UIView()
        addSubview(gapView)
        gapView.translatesAutoresizingMaskIntoConstraints = false
        gapView.heightAnchor.constraint(
                            equalToConstant: 1.0).isActive = true
        gapView.centerYAnchor.constraint(
                            equalTo: centerYAnchor).isActive = true
        gapView.widthAnchor.constraint(equalTo: widthAnchor,
             multiplier: viewModel.barGapPctOfTotal).isActive = true
        gapView.leftAnchor.constraint(
                        equalTo: lastBar.rightAnchor).isActive = true
        return gapView
    }
One additional note: even though the gap views are invisible, iOS considers it an error if we don't provide information to set the vertical position and height for these invisible views. While the view would look ok without the heightAnchor and centerYAnchor constraints, iOS would generate [purple] layout warnings when running the app in Xcode, and generate debug console warnings. Be mindful of layout warnings and strive to eliminate them.
At this point, the layout is complete, and if we used the chart view, it would render bars according to the data provided in the *setData(..) method. *Hooray!
Implement the UITapGestureRecognizer
The final feature for the chart is the tap gesture recognizer, so let's finish by implementing that feature.
We already added the *tapRecognizer *instance variable to keep a reference to the recognizer, but we didn't actually initialize it yet.
Below, an init method is added, and within *init(coder) *the tapRecognizer is initialized and the tapRecognizer method is set as the handler for the tap.
The init?(coder:) method added is the init method called when the chart UIView is embedded in a storyboard. For this tutorial, this is the only initializer needed. However, if the TutorialChartView will be created from code, it would need an appropriate initializer (i.e. default or accepting CGRect), because init(coder:) would not be called in that case, and the gesture recognizer wouldn't be initialized.
class TutorialChartView: UIView {
    var viewModel = TutorialChartViewModel()
    var tapRecognizer:UITapGestureRecognizer!

    required init?(coder: NSCoder) {
        super.init(coder: coder)
        tapRecognizer = UITapGestureRecognizer(
                        target: self, action: #selector(handleBarTap))
        addGestureRecognizer(tapRecognizer)
    }

    deinit {
        removeGestureRecognizer(tapRecognizer)
    }
    .
    .
    .
}
Add Hit Testing to find the bar being tapped
At this point the *handleBarTap *method will be called whenever the chart is tapped. However, it's not enough to know that the chart was tapped--we need to know which bar is tapped.
Luckily, iOS provides a hit test function to provide a reference to which subview is tapped when a view tap recognizer is activated. We can implement the hit test in the *handleBarTap *method to discover which specific subview has been tapped, and then use the bar tag (added in *createBarView) *to highlight only the bar that was tapped (and not highlight bars that weren't tapped).
@objc func handleBarTap() {
        if let hitView = tapRecognizer.view {
            let loc = tapRecognizer.location(in: self)
            if let barViewTapped = hitView.hitTest(loc, with: nil) {
                for barView in subviews where barView.tag >= 1000 {
                    barView.backgroundColor =
                           barView.tag == barViewTapped.tag ?
                            viewModel.barColor.withAlphaComponent(0.4)
                                 : viewModel.barColor
                }

            }
        }
    }
Putting the TutorialChartView together
Here's the completed TutorialChartView.swift module:
import UIKit

class TutorialChartView: UIView {
    var viewModel = TutorialChartViewModel()
    var tapRecognizer:UITapGestureRecognizer!

    required init?(coder: NSCoder) {
        super.init(coder: coder)
        tapRecognizer = UITapGestureRecognizer(target: self,
                               action: #selector(handleBarTap))
        addGestureRecognizer(tapRecognizer)
    }

    deinit {
        removeGestureRecognizer(tapRecognizer)
    }

    func setData(_ dataPoints: [Double]) {
        backgroundColor = UIColor.clear

        viewModel.dataPoints = dataPoints
        clearViews()

        // Do not continue if no bar has height > 0
        guard viewModel.maxY > 0.0 else { return }
        createChart()
    }

    func clearViews() {
        for view in subviews {
            view.removeFromSuperview()
        }
    }

    func createChart() {
        var lastBar:UIView?

        for (i, dataPoint) in viewModel.dataPoints.enumerated() {
            let barView = createBarView(barNumber: i,
                                        barValue: dataPoint)

            if let lastBar = lastBar {
                let gapView = createGapView(lastBar: lastBar)
                barView.leftAnchor.constraint(
                    equalTo: gapView.rightAnchor).isActive = true
            } else {
                barView.leftAnchor.constraint(
                    equalTo: leftAnchor).isActive = true
            }

            if i == viewModel.dataPoints.count - 1 {
                barView.rightAnchor.constraint(
                    equalTo: rightAnchor).isActive = true
            }

            // All bars pinned to bottom of containing view
            barView.bottomAnchor.constraint(
                    equalTo: bottomAnchor).isActive = true

            // calculate height of bar relative to maxY
            barView.heightAnchor.constraint(
                    equalTo: heightAnchor,
                    multiplier: CGFloat(dataPoint /
                             viewModel.maxY)).isActive = true

            lastBar = barView
        }
    }

    func createBarView(barNumber: Int, barValue: Double) -> UIView {
        let barView = UIView()
        addSubview(barView)
        barView.translatesAutoresizingMaskIntoConstraints = false
        barView.widthAnchor.constraint(
                            equalTo: widthAnchor,
                            multiplier:
                                 viewModel.barWidthPctOfTotal)
                                                   .isActive = true

        barView.tag = barNumber + 1000
        barView.backgroundColor = viewModel.barColor
        barView.layer.cornerRadius = viewModel.barCornerRadius

        return barView
    }

    func createGapView(lastBar: UIView) -> UIView {
        let gapView = UIView()
        addSubview(gapView)
        gapView.translatesAutoresizingMaskIntoConstraints = false
        gapView.heightAnchor.constraint(
                         equalToConstant: 1.0).isActive = true
        gapView.centerYAnchor.constraint(4
                        equalTo: centerYAnchor).isActive = true
        gapView.widthAnchor.constraint(
                        equalTo: widthAnchor,
                        multiplier:
                           viewModel.barGapPctOfTotal).isActive = true
        gapView.leftAnchor.constraint(
                   equalTo: lastBar.rightAnchor).isActive = true
        return gapView
    }

    @objc func handleBarTap() {
        if let hitView = tapRecognizer.view {
            let loc = tapRecognizer.location(in: self)
            if let barViewTapped = hitView.hitTest(loc, with: nil) {
                for barView in subviews where barView.tag >= 1000 {
                    barView.backgroundColor =
                         barView.tag == barViewTapped.tag ?
                          viewModel.barColor.withAlphaComponent(0.4)
                          : viewModel.barColor
                }
            }
        }
    }
}
Adding TutorialChartView to a Storyboard UIViewController
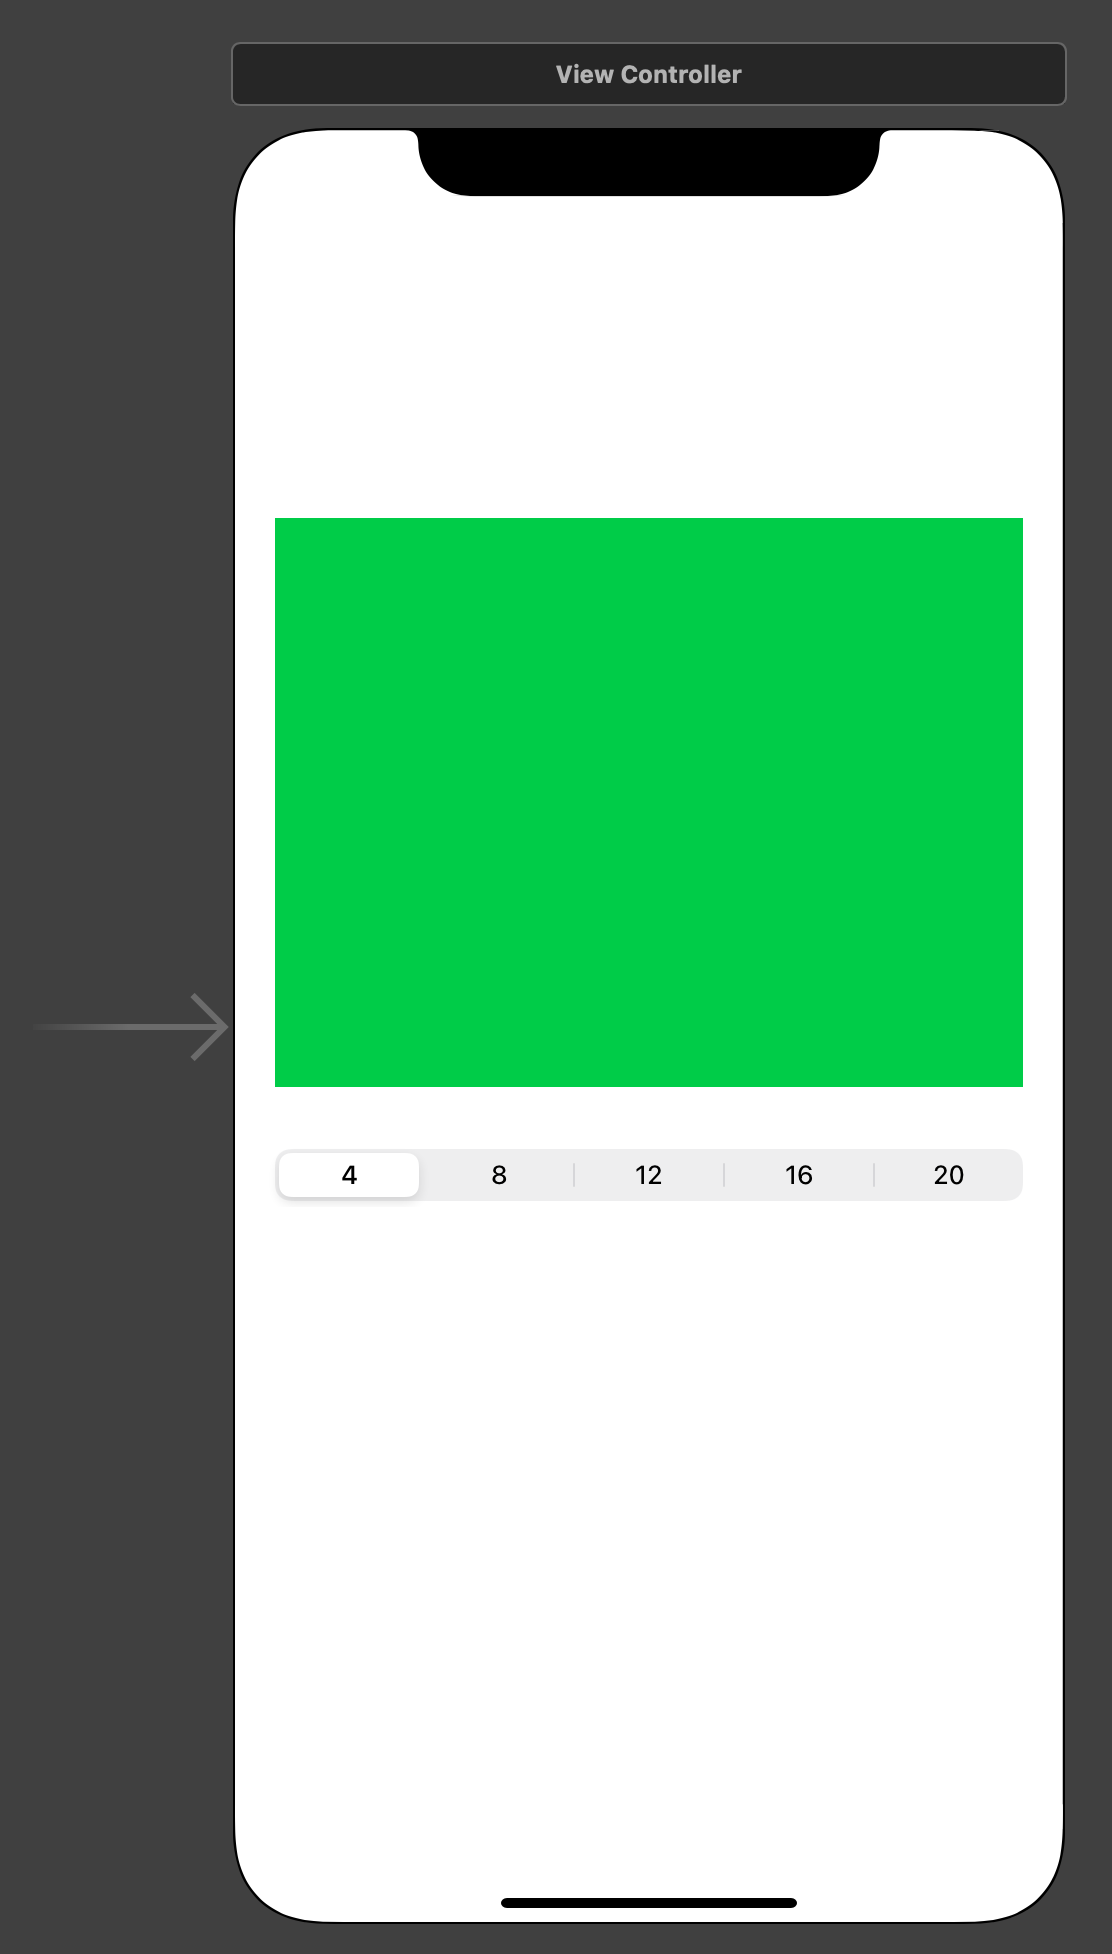
Finally, let's put the view to work by adding it to a Storyboard view. I won't go through all the steps to create a basic app with a single main window (I assume you know how to do that). Below is the ViewController I've created, which has a TutorialChartView (the green view), and a segment control below it.
In my test implementation, when the user taps on a segment in the segment control, the View Controller creates an array of random values with the selected number of elements, and calls the chart's setData([Double]) method to redraw the chart.
View Controller code
In the code below, when a segment is selected, an array is created, filled with random values, and sent to the chart for display.
class ViewController: UIViewController {

    @IBOutlet weak var chartView: TutorialChartView!

    @IBAction func SegmentSelected(_ sender: UISegmentedControl) {
        let numSegments = (sender.selectedSegmentIndex + 1) * 4

        var dataPoints = [Double]()

        for _ in 0..<numSegments {
            dataPoints.append(Double.random(in: 20.0...100.0))
        }

        chartView.setData(dataPoints)
    }
}
Final Functionality
Here's an animation of how the final test app looks when running:
GitHub Source Code
The full source code for the project, including the TutorialChartView, its View Model and the ViewController is available in my GitHub repo here.